.svg)

In several previous posts on MLOps tooling, I showed how many popular MLOps tools track metrics associated with model training experiments. I also showed how they use MinIO to store the unstructured data that is a part of the model training pipeline. However, a good MLOps tool should do more than manage your experiments, datasets, and models. It should be able to deploy your models across your organization's various environments, moving them to development, test, and production environments.
Also, at MinIO, we have noticed an above-average interest in our MLOps content. Many of our partners have seen the same. Perhaps 2025 is the year when enterprises reign in machine learning projects and pull them into formal CI/CD pipelines managed by MLOps tooling.
In this post, I’ll focus on MLflow and show how a trained model can be hosted locally using MLserve, a simple tool Mlflow provides for testing a model’s RESTful interface. Finally, I’ll show how to deploy the model to a Kubernetes cluster using KServe. KServe is an open-source model serving framework designed for Kubernetes, specifically built to deploy and serve machine learning (ML) models at scale. It provides a standardized serverless inference platform that supports various ML frameworks, including TensorFlow, PyTorch, XGBoost, and Scikit-Learn.
MLFlow Set Up
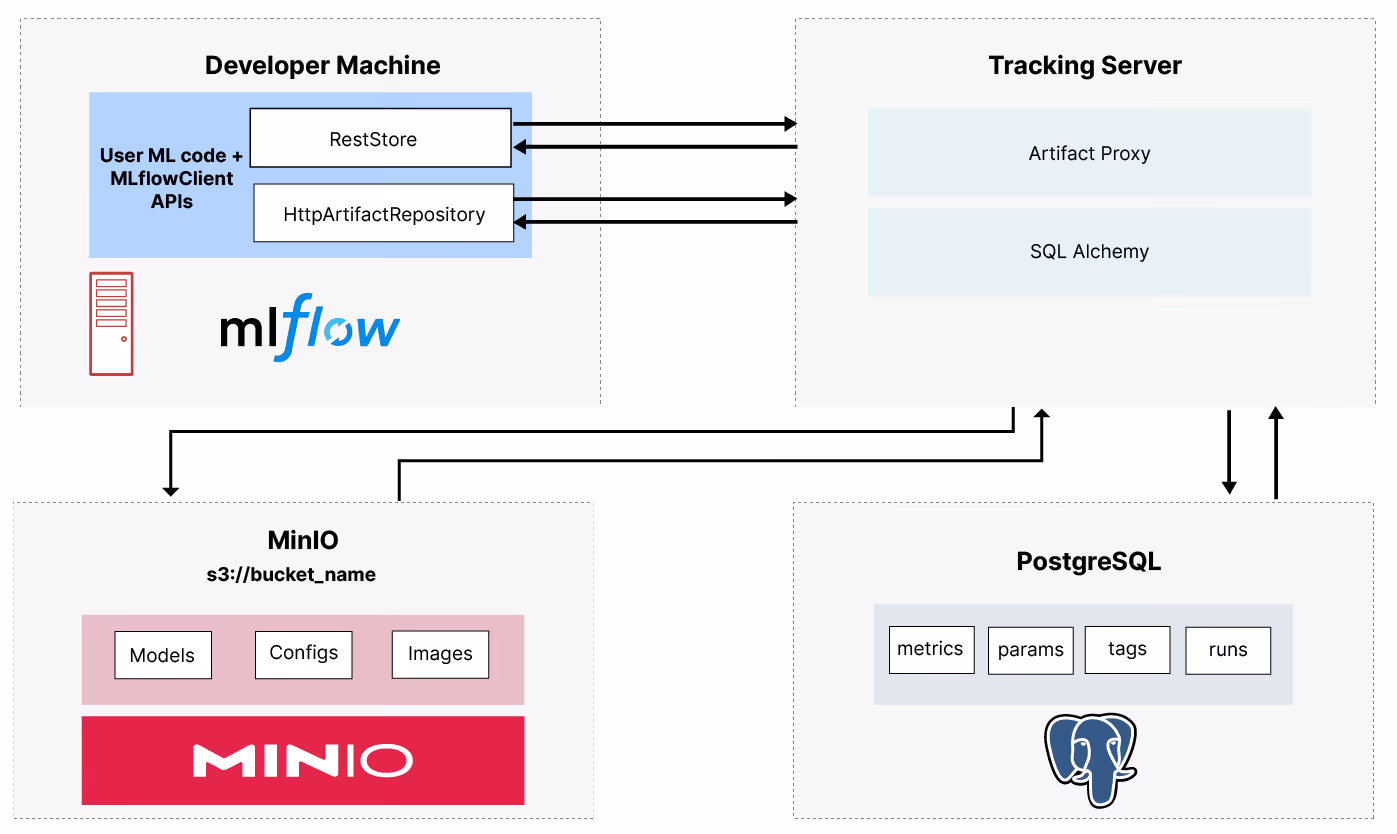
Check out Setting up a Development Machine with MLFlow and MinIO to get MLflow set up on your development machine. This post provides some background on MLflow, describes the products it uses under the hood (PostgreSQL and MinIO), and finally shows how to create and load a docker-compose file for local emulation. The diagram below shows the relationship between the MLflow tracking server, PostreSQLm and MinIO.
KServe Set Up
To set up KServe, you will need to install kind and Helm. You will also need to clone the KServe repository and run an install script within it. I’ll provide a recipe below for installing everything so you do not have to bounce around the internet for various installation instructions. If you are unfamiliar with these tools or want additional information, check out the links I provided.
1. Install kind
Kind has a different download depending on your chip architecture. So, the first thing you need to do is determine your chip architecture using the following command.
uname -m
You should see something like arm64, amd64, or x86_64. For amd64 or x86_64 run the following command to download the AMD install. This will create a new subdirectory named kind that will contain everything needed to run kind.
curl -Lo ./kind https://kind.sigs.k8s.io/dl/v0.26.0/kind-linux-amd64
For arm64, use the command below. This will also create a new subdirectory.
curl -Lo ./kind https://kind.sigs.k8s.io/dl/v0.26.0/kind-linux-arm64
Finally, change the permissions on this directory so that files contained within it can execute code. Then move it to the usr/local/bin directory.
chmod +x ./kind
sudo mv ./kind /usr/local/bin/kind
2. Setup a Kubernetes Cluster
We can now use kind to create a Kubernetes cluster. Run the three commands below to create a default cluster named ‘kind’, use the default ‘kind-kind’ context, and create a namespace for our deployment.
kind create cluster
kubectl config use-context kind-kind
kubectl create namespace mlflow-kserve-test
A few other helpful kind and kubectl commands for managing clusters are below.
kind create cluster --name <cluster_name>
kubectl config get-contexts
kind get clusters
kind delete cluster
3. Install Helm
To install Helm, run the three commands below, which will download the Helm shell install script, change its permissions so it can run, and then run it.
curl -fsSL -o get_helm.sh https://raw.githubusercontent.com/helm/helm/main/scripts/get-helm-3
chmod 700 get_helm.sh
./get_helm.sh
4. Install KServe
KServe’s online guide for Getting Started with KServe on a local Kubernetes cluster has a broken link to their quick-install script. To get around this until the link is fixed, we will clone the KServe GitHub repo and navigate directly to the install script.
git clone https://github.com/kserve/kserve.git
cd hack
bash quick_install.sh
This command will take a while to complete. It installs KServe and all the KServe dependencies: Istio, Knative, and Cert-manager. These dependencies are described below.
Istio is an open-source service mesh that helps manage microservices in cloud-native applications. It allows applications to communicate and share data securely.
Knative is an open-source project that extends Kubernetes to help users build, run, and manage serverless functions. Knative is an alternative to proprietary serverless solutions like AWS Lambda and Azure Functions.
Cert-manager is an open-source tool that automates the management of TLS certificates for Kubernetes and OpenShift workloads.
Logging and Registering Models
The rest of this post will use a simple model created with the sklearn code shown below. This training function creates an sklearn model that takes 13 features of a bottle of wine and predicts whether it is a red wine or a white wine.
import mlflow
import numpy as np
from sklearn import datasets, metrics
from sklearn.linear_model import ElasticNet
from sklearn.model_selection import train_test_split
def eval_metrics(pred, actual):
rmse = np.sqrt(metrics.mean_squared_error(actual, pred))
mae = metrics.mean_absolute_error(actual, pred)
r2 = metrics.r2_score(actual, pred)
return rmse, mae, r2
def train_model():
# Set th experiment name
mlflow.set_experiment("wine-quality")
mlflow.set_tracking_uri('http://localhost:5001')
# Enable auto-logging to MLflow
#mlflow.sklearn.autolog()
# Load wine quality dataset
X, y = datasets.load_wine(return_X_y=True)
X_train, X_test, y_train, y_test = train_test_split(X, y, test_size=0.25)
# Start a run and train a model
with mlflow.start_run(run_name="default-params"):
model = ElasticNet()
model.fit(X_train, y_train)
y_pred = model.predict(X_test)
rmse, mae, r2 = eval_metrics(y_pred, y_test)
mlflow.log_metrics({"rmse": rmse, "r2": r2, "mae": mae})
# Log and register the model.
model_signature = mlflow.models.infer_signature(X_test, y_pred)
mlflow.sklearn.log_model(model, "model",
registered_model_name="wine-quality-model",
signature=model_signature)
return metrics
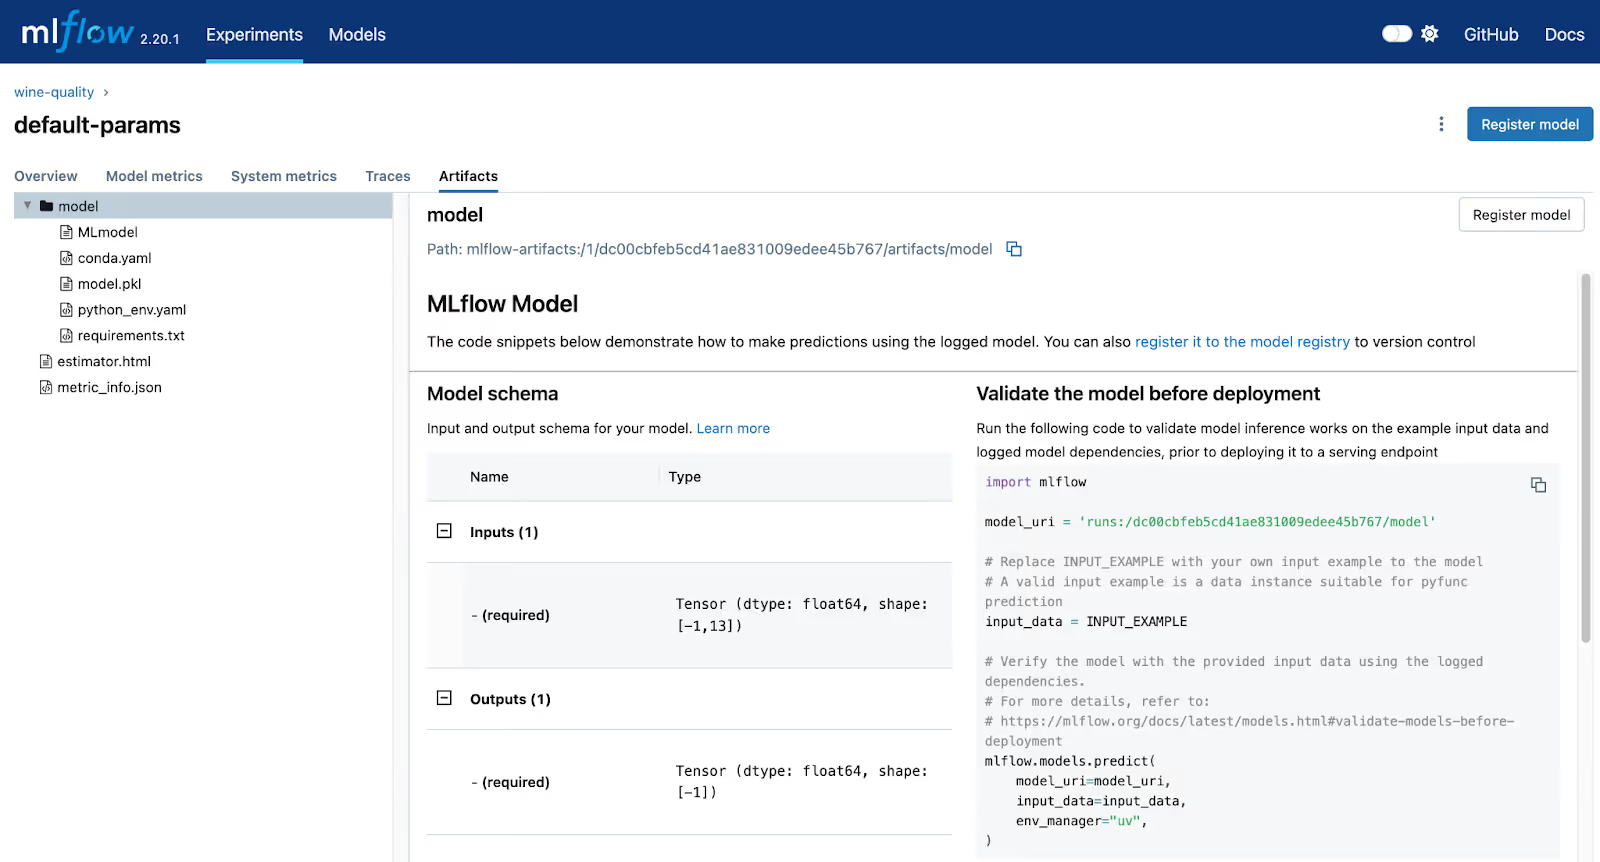
This code logs and registers the model in MLflow’s (highlighted code) model registry. When the registered_model_name parameter is specified, the log_model function will log and register the model. This is where we will pull the model when we deploy it to KServe. The screenshot below shows our logged model in the MLflow UI. The path shows the location of this model in MinIO, and the model_uri shows the URI that needs to be used when we deploy the model.
If you want more information on logging and registering models, check out MLflow Model Registry and MinIO.
Testing Model Deployments with MLServe
MLflow comes with a handy command line tool that allows you to run a local inference server with just a single command. Remember to use the enable-mlserver flag, which instructs MLflow to use MLServer as the inference server. This ensures the model runs in the same manner as it would in Kubernetes. The command below will deploy a logged model to MLServer. The model uri (highlighted) must match the model uri shown in the screenshot above.
export MLFLOW_TRACKING_URI=http://localhost:5000
mlflow models serve -m runs:/dc00cbfeb5cd41ae831009edee45b767/model -p 1234 --enable-mlserver
If you wish to deploy a registered model, use the below command. Here, the model reference is of the form “models/{model name}/{version}. The model name was assigned when the model was registered.
mlflow models serve -m models:/wine-quality-model/1 -p 1234 --enable-mlserver
The snippet below will send a sample input to the service and return a prediction. Models prefer batches of input; consequently, the input below is a list of lists (or matrix). If you specify a simple list (or vector), the service will throw an error.
import requests
import json
url = f"http://localhost:1234/invocations"
payload = json.dumps(
{
"inputs": [[14.23, 1.71, 2.43, 15.6, 127.0, 2.8, 3.06, 0.28, 2.29, 5.64, 1.04, 3.92, 1065.0]],
}
)
response = requests.post(
url=url,
data=payload,
headers={"Content-Type": "application/json"},
)
print(response.json())
The output should look like the text below, which represents a probability that the input features represent a bottle of red wine.
{'predictions': [0.4097722993507402]}
Building a Docker Image
In this tutorial, I will create a docker image that contains the model we trained above. This image will eventually get deployed to Kubernetes and run via KServe. MLflow has a nice command line utility that will take a reference to our logged (or registered) model and create a docker image with it. This command is shown below.
mlflow models build-docker -m runs:/dc00cbfeb5cd41ae831009edee45b767/model -n keithpij/mlflow-wine-classifier --enable-mlserver
Pay attention to the model parameter (-m), which specifies the model in MLflow that you wish to place into an image. This string must match the model name we saw in the MLflow UI after logging the trained model. The image name parameter (-n) is how you specify the name of your image. Make sure that the first part of this name is your docker username, as we need to push this to Docker’s image registry. We will do this next. The command below will push the image we just created to Docker Hub.
docker push keithpij/mlflow-wine-classifier
Once the image is created and pushed to Docker Hub, you can sign into Docker Hub to view the image.
Deploying an Inference Service to Kubernetes
To deploy our image to Kubernetes using KServe we need to create a kubectl file. This is shown below.
apiVersion: "serving.kserve.io/v1beta1"
kind: "InferenceService"
metadata:
name: "mlflow-wine-classifier"
namespace: "mlflow-kserve-test"
spec:
predictor:
containers:
- name: "wine-classifier"
image: "keithpij/mlflow-wine-classifier"
ports:
- containerPort: 8080
protocol: TCP
env:
- name: PROTOCOL
value: "v2"
This kubectl file will create a KServe inference service. Pay attention to the namespace and image fields highlighted above. The namespace needs to be the namespace previously created. The image needs to be the image that was pushed to Docker Hub. Assuming that the file above is named sklearn-wine.yaml we can run the command below to deploy the image.
kubectl apply -f sklearn-wine.yaml
The service will take a while to deploy. Once it is deployed, you can run the command below to see the details of the new inference service.
kubectl get inferenceservices -n mlflow-kserve-test
An abbreviated version of the output of this command is shown below.
NAME URL READY
mlflow-wine-classifier http://mlflow-wine-classifier.mlflow-kserve-test.example.com True
Below are a few useful Kubernetes commands to help troubleshoot problems with this service and delete the service if you need to start over. Looking at pod logs is especially useful if your service is not starting and the previous command is not reporting a ready status.
kubectl get namespaces
kubectl get pods -n <namespace>
kubectl -n <namespace> logs <pod-name>
kubectl delete -f sklearn-wine.yaml -n mlflow-kserve-test
Determine Ingress Host and Service Host
Before sending a request to our new Inference Service, we must determine the ingress and service hosts. Recall that when we installed KServe, it came with istio, which will act as a proxy for our inference service. Consequently, we need to determine the address the istio is listening on. We also need to determine the address of our inference service so that we can include this address in the header or our request so that istio can direct the request appropriately. First, let's figure out the address for istio.
kubectl get svc istio-ingressgateway -n istio-system
If the EXTERNAL-IP value is set, you are running in an environment with an external load balancer that you can use for the ingress gateway. Use the commands below to get the ingress host address and ingress port.
export INGRESS_HOST=$(kubectl -n istio-system get service istio-ingressgateway -o jsonpath='{.status.loadBalancer.ingress[0].ip}')
export INGRESS_PORT=$(kubectl -n istio-system get service istio-ingressgateway -o jsonpath='{.spec.ports[?(@.name=="http2")].port}')
To run on a local cluster like kind, which we are doing in this post, use port forwarding by running the commands below.
INGRESS_GATEWAY_SERVICE=$(kubectl get svc --namespace istio-system --selector="app=istio-ingressgateway" --output jsonpath='{.items[0].metadata.name}')
echo $INGRESS_GATEWAY_SERVICE
kubectl port-forward --namespace istio-system svc/${INGRESS_GATEWAY_SERVICE} 8080:80
Finally, we need the service hostname that points to the pod in our cluster that contains our model.
SERVICE_HOSTNAME=$(kubectl get inferenceservice mlflow-wine-classifier -n mlflow-kserve-test -o jsonpath='{.status.url}' | cut -d "/" -f 3)
echo $SERVICE_HOSTNAME
Testing the Inference Service
We are now ready to test the inference service running in KServe. The snippet below is similar to the snippet we used earlier. However, the payload is slightly different. This is KServe’s V2 protocol. Be careful with the URL used for the address of this request. The MLflow documentation states that this URL must contain the model's name. This will not work when you build your own image as we did here. For some reason, the model name gets hardcoded to “mlflow-model�?. (This took me a long time to figure out.) KServe will find your inference service using the host header.
url = f"http://localhost:8080/v2/models/mlflow-model/infer"
payload = json.dumps(
{
"inputs": [
{
"name": "input",
"shape": [1,13],
"datatype": "FP64",
"data": [[14.23, 1.71, 2.43, 15.6, 127.0, 2.8, 3.06, 0.28, 2.29, 5.64, 1.04, 3.92, 1065.0]]
}
]
}
)
response = requests.post(
url=url,
data=payload,
headers={"Host": "mlflow-wine-classifier.mlflow-kserve-test.example.com",
"Content-Type": "application/json"},
)
print(response.json())
Summary
If you have gotten this far, you have used MLflow end to end. In this post, we created a model, tracked its metrics after training it, logged the model, and deployed it to a local Kubernetes cluster using KServe, which we installed from scratch. If you follow the online documentation from MLflow and KServe, there are a few gotchas, so use this guide as your starting point. If you want more details on setting up Mlflow, metric tracking, model logging, and using MLflow for distributed model training, then check out these posts:
Setting up a Development Machine with MLFlow and MinIO
MLflow Model Registry and MinIO
Distributed Training and Experiment Tracking with Ray Train, MLflow, and MinIO
If you run into any problems or have any questions, be sure to reach out to me on Slack.
In this technical deep-dive, I'll demonstrate how AIStor creates a unified foundation for data engineers who need to support everything from traditional analytics to cutting-edge AI/ML workloads. Instead of theoretical examples, we'll examine a real implementation of a Kafka-based streaming pipeline that handles two critical functions simultaneously: preserving raw events for data scientists while generating aggregated insights for business dashboards. The best part? The same code runs seamlessly whether you're operating in AWS, Azure, or your own data centers — no more sacrificing features for data sovereignty requirements.
This implementation demonstrates how AIStor enables a Java-based data pipeline that handles 10s of millions of Kafka events without complex infrastructure. We've included the complete source code showing how this was built as an enterprise-grade solution that simultaneously preserves raw events for compliance and data science while generating pre-aggregated datasets for KPIs and dashboards. This architecture scales linearly from development laptops to production clusters, eliminating the traditional tradeoffs between flexibility, performance, and deployment location.
THE POWER AND FLEXIBILITY OF DATA PIPELINES
Data pipelines can be designed in numerous ways depending on your specific requirements. Whether you need stream processing, batch processing, or a hybrid approach, your chosen architecture should align with your business needs. The example we'll examine today demonstrates a straightforward yet powerful approach to handling event data from Kafka, but is also relevant to other similar streaming technologies.
UNDERSTANDING THIS SAMPLE PIPELINE
This pipeline demonstrates a common pattern in data processing: consuming events from a messaging system (Kafka), storing them in their raw form for future reference, and simultaneously performing aggregations to extract immediate insights.
Let's visualize the overall architecture:
[image: GHOST_URL/content/images/2025/05/image2.png — alt: image2.png]
And the main components of this codebase:
[image: GHOST_URL/content/images/2025/05/image1.png — alt: image1.png]
PREREQUISITES
- x86 Linux-based OS/mac OS
- Running Docker engine (colima)
- docker cli
- docker-compose cli
- JDK 17+
- maven
- git
- curl
CONFIGURATION PARAMETERS
The configuration parameters are in the following files:
src/main/java/com/minio/training/labs/pipeline/config/AppConfig.java:
eventsToGenerate: Number of synthetic events to generatemaxPollRecords: Maximum number of records to poll from Kafka at once, and write to MinIO Raw and Aggregate Dataset
src/main/java/com/minio/training/labs/pipeline/processor/DirectKafkaEventProcessor.java:
POLL_TIMEOUT_MS: Timeout for Kafka consumer polling in millisecondsFLUSH_THRESHOLD: Minimum number of data grains produced by the Aggregator before writing to MinIO Aggregate Dataset
Details are in the README.md in the Code link in the Containerized Deployment section.
KEY COMPONENTS EXPLAINED
DATA GENERATION
This pipeline begins with the data generator, which creates synthetic events based on a predefined schema. We're using an e-commerce schema for demonstration purposes that includes fields like user_id, country, action, and value.
Example of an event is below where 10s of millions of such events with the cardinality expressed in SchemaDefinition are generated.
{
  "eventGuid": "67f4dfdd-c4db-4f8d-aa90-24da30f760ac",
  "timestamp": 1742199657865,
  "country": "country_20",
  "is_returning": true,
  "user_id": "user_id_694",
  "action": "action_3",
  "device_type": "device_type_1",
  "page": "page_9",
  "category": "category_13",
  "value": 39.259011259415466,
  "session_duration": 243
}
This is how the event is generated.
public Event generateEvent() {
    Map<String, Object> fields = new HashMap<>();

    // Generate values for each column in the schema
    for (SchemaDefinition.ColumnDefinition column : schema.getColumns()) {
        fields.put(column.getName(), column.generateValue(random));
    }

    return new Event(fields);
}
KAFKA INTEGRATION
Events are sent to Kafka, which serves as the central messaging system. The KafkaEventProducer handles this.
public void sendEvent(Event event) {
    try {
        String json = objectMapper.writeValueAsString(event);
        ProducerRecord<String, String> record = new ProducerRecord<>(
            config.getKafka().getTopic(),
            event.getEventGuid(),
            json
        );

        producer.send(record, (metadata, exception) -> {
            if (exception != null) {
                log.error("Error sending event to Kafka", exception);
            } else {
                profiler.recordProducerEvent();
            }
        });
    } catch (Exception e) {
        log.error("Error serializing event", e);
    }
}
EVENT PROCESSING AND MINIO’S AISTOR INTEGRATION
The heart of this pipeline is the DirectKafkaEventProcessor, which consumes events from Kafka and performs two primary operations:
- Raw Event Storage: Storing events in their original format for future reference or detailed analysis
- Real-time Aggregation: Creating aggregated views of the data to provide immediate insights
As the events are consumed, they are batched based on the batchSize and sinked into AIStor. With respect to Real-time Aggregation, the events are also processed for aggregation, where they are checked for duplication using eventGuid within a sliding window, grouped to a single dimension or multi-dimension, and written to an aggregation buffer. When the FLUSH_THRESHOLD has been reached, the buffer is linked to AIStor and cleared for the next set of events.
The AIStor integration makes this storage process remarkably simple. Here's how we write raw events:
private void writeRawEventsToJson(List<Event> events, String timestamp) {
    if (events.isEmpty()) {
        return;
    }

    try {
        // Include UUID in filename to ensure uniqueness
        String filename = String.format("events_%s_%s.json",
            timestamp, UUID.randomUUID().toString().substring(0, 8));

        // Partition by year/month/day/hour for efficient querying
        String s3Key = String.format("raw-json/%s/%s/%s/%s/%s",
            "year=" + timestamp.substring(0, 4),
            "month=" + timestamp.substring(5, 7),
            "day=" + timestamp.substring(8, 10),
            "hour=" + timestamp.substring(11, 13),
            filename);

        String jsonContent = objectMapper.writeValueAsString(events);
        byte[] content = jsonContent.getBytes(StandardCharsets.UTF_8);

        // Simple AIStor/S3 PUT operation
        s3Client.putObject(PutObjectRequest.builder()
            .bucket(config.getS3().getS3Bucket())
            .key(s3Key)
            .contentType("application/json")
            .build(),
            RequestBody.fromBytes(content));

        log.debug("Wrote {} raw events to MinIO: {}", events.size(), s3Key);
    } catch (Exception e) {
        log.error("Failed to write raw events to MinIO", e);
    }
}
And for aggregated events:
private void writeAggregatedEventsToJson(List<AggregatedEvent> aggregatedEvents, String timestamp) {
    // Similar to raw events, but with processed aggregated data
    // ...
    s3Client.putObject(PutObjectRequest.builder()
        .bucket(config.getS3().getS3Bucket())
        .key(s3Key)
        .contentType("application/json")
        .build(),
        RequestBody.fromBytes(content));
    // ...
}
SIMPLIFYING STORAGE WITH MINIO’S AISTOR
One of the standout features of this pipeline is the simplicity of data storage through AIStor. This property means this pipeline can handle increasing data volumes without requiring code changes.
The configuration for connecting to AIStor is straightforward:
AwsBasicCredentials credentials = AwsBasicCredentials.create(
        config.getS3().getS3AccessKey(),
        config.getS3().getS3SecretKey());

s3Client = S3Client.builder()
        .endpointOverride(URI.create(config.getS3().getS3Endpoint()))
        .credentialsProvider(StaticCredentialsProvider.create(credentials))
        .region(Region.US_EAST_1)
        .httpClient(UrlConnectionHttpClient.builder().build())
        .forcePathStyle(true)
        .build();
REAL-TIME AGGREGATION
This pipeline demonstrates a simple but powerful real-time aggregation pattern. As events flow through the system, they're aggregated by various dimensions such as time window, country, action, and category.
private void processEventForAggregation(Event event) {
    // Skip if event was already processed within our deduplication window
    if (!processedEventGuids.add(event.getEventGuid())) {
        return;
    }

    LocalDateTime eventTime = LocalDateTime.ofInstant(
        Instant.ofEpochMilli(event.getTimestamp()),
        ZoneOffset.UTC
    );

    LocalDateTime windowStart = eventTime.truncatedTo(ChronoUnit.HOURS);

    String userId = event.getFields().getOrDefault(
        "user_id", "unknown").toString();

    for (Map.Entry<String, Object> field : event.getFields().entrySet()) {
        String fieldName = field.getKey();

        if (!fieldName.equals("country") && !fieldName.equals("device_type") &&
            !fieldName.equals("action") && !fieldName.equals("page") &&
            !fieldName.equals("category")) {
            continue;
        }

        Object fieldValue = field.getValue();
        if (fieldValue == null) {
            continue;
        }
        // single dimension
        String key = String.format("%s::%s:%s",
            windowStart.format(pathFormatter),
            fieldName, fieldValue
        );

        // multi dimension
        // String key = String.format("%s::%s:%s::%s:%s::%s:%s::%s:%s::%s:%s",
        //         windowStart.format(pathFormatter),
        //         "country", event.getFields().get("country"),
        //         "device_type", event.getFields().get("device_type"),
        //         "action", event.getFields().get("action"),
        //         "page", event.getFields().get("page"),
        //         "category", event.getFields().get("category")
        // );

        // Update aggregations...
    }
}
HOW THIS APPROACH WORKS
- Dual Storage Strategy: By storing both raw and aggregated data, you get the best of both worlds — detailed records for auditing or deep analysis, and fast access to insights through aggregations.
- Flexibility: The code can be extended to support different aggregation dimensions or additional processing steps without changing the core architecture.
- Scalability: As data volumes grow, the system can scale horizontally by adding more Kafka partitions or increasing the processing capacity.
ADAPTING TO DIFFERENT WORKLOADS
While this example shows a specific implementation, the same architecture can be adapted for various workloads:
- High-velocity trading data: By adjusting the aggregation windows and buffering strategy
- IoT sensor data: By modifying the schema and adding time-series specific aggregations
- User behavior analytics: By implementing more complex session-based aggregations
- Payment processing: By adding transaction validation rules and real-time aggregations for fraud detection, while maintaining both raw transaction records for compliance and summary data for financial reporting
- Log data processing: By implementing parsers for various log formats and adding real-time aggregations for error rates, performance metrics, and security events, with time-based partitioning to support both immediate alerting and historical analysis
RUNNING THE PIPELINE IN PRODUCTION
This data pipeline is designed for flexible deployment across various environments, with containerization making it easy to move from development to production.
JAVA RUNTIME ENVIRONMENT
The core pipeline is implemented in Java, providing several advantages:
- Cross-platform compatibility: Runs consistently across different operating systems
- Rich ecosystem: Leverages mature libraries for Kafka, AIStor integration
- Enterprise readiness: Supports monitoring, metrics collection, and logging integration
CONTAINERIZED DEPLOYMENT
The entire pipeline (Code: Link) is containerized using Docker, simplifying deployment and ensuring consistency.
./run_pipeline.sh
This script:
- Builds the Java application
- Starts the infrastructure containers (Kafka, AIStor/MinIO, Prometheus, Grafana)
- Deploys the data processing container
- Sets up monitoring services
- The Docker Compose configuration handles:
- Container networking
- Volume management for persistent storage
- Environment variable injection for configuration
- Service dependencies and startup order
With consistent behavior and performance characteristics, the pipeline can be deployed in various environments, from a local development machine to a production Kubernetes cluster.
CONCLUSION
Building a data pipeline doesn't have to be complicated. With AIStor and Kafka, you can quickly implement a solution that handles both raw data storage and real-time aggregation. This example demonstrates just one approach to processing Kafka events, but the same principles can be applied to various data processing needs.
The combination of Kafka for messaging and AIStor for storage provides a powerful foundation for building scalable, resilient data pipelines that grow with your business needs. By separating the concerns of data ingestion, processing, and storage, you create a system that's easier to maintain and evolve. Whether you're just starting with data pipelines or looking to optimize an existing solution, consider this architecture as a template that can be customized to your specific requirements.
If you have any questions, please feel free to contact us at hello@min.io or Slack: https://slack.min.io/.
.svg)